How Do Prediction Markets Work? Price, Probability and Payout Explained
Prediction markets turn prices into probabilities. Here is how a share is priced, how the outcome is decided and what you actually get paid.
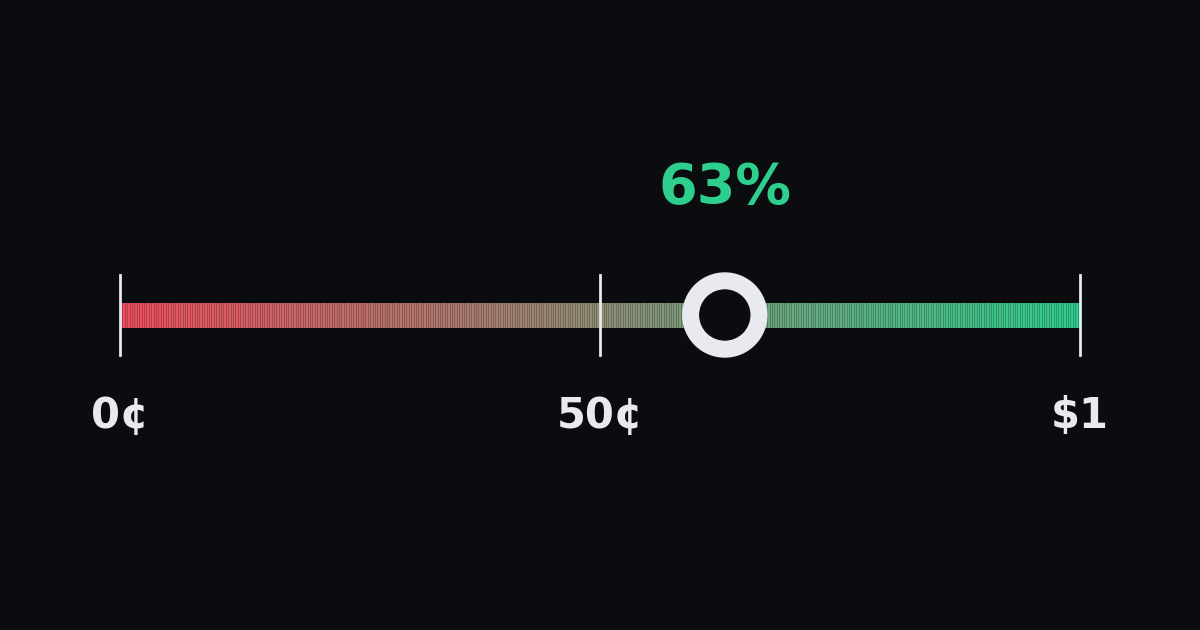
A prediction market is a market where people buy and sell "Yes" and "No" shares on the outcome of a real-world event. A share trades between 0¢ and $1, and its price reads as the market's probability: "Yes" at 63¢ means traders, taken together, put the chance at about 63%. If the event happens, each "Yes" share pays $1. If it doesn't, the share pays $0.
What is a prediction market?
A prediction market is a market whose price is a forecast. Each market is built around a single question. The question has a deadline and names the source that will decide the answer, for example: "Will the central bank cut interest rates at its December meeting?" (a hypothetical market used throughout this guide).
For a question to be tradable, it needs an outcome that can be checked as yes or no, a deadline, and resolution rules published before trading starts. The rules say which source counts and what happens if the event is delayed or cancelled.
Some markets have more than two possible outcomes, such as "Which team will win the tournament?" These are usually built as a set of yes-or-no questions, one per team, so the same logic applies to each.
People use prediction markets in two ways. Some trade their view on an event. Others simply read the price as a summary of what the crowd expects. Economists have studied these markets for decades because a single market price pools what many people know into one number (Wolfers & Zitzewitz, 2004).
How does a share's price become a probability?
A "Yes" share is worth $1 if the event happens and nothing if it doesn't, so its fair price equals the chance of the event. If you think something has a 70% chance, paying 70¢ for a share that pays $1 seven times out of ten is break-even before fees. When many people with different information trade, the price settles where buyers and sellers balance. That price is what we read as the market's probability.
A "Yes" price of 63¢ means the market puts the probability at about 63%.
A few rules of thumb:
- "Yes" plus "No" is close to $1. If "Yes" trades at 63¢, "No" trades near 37¢. The small gap between the best buying and selling prices is the spread.
- A higher price means more confidence. A share at 90¢ is an outcome the market expects; a share at 10¢ is one it doubts.
- The number moves with every trade. News and data releases show up as price changes, often within minutes.
A price is still not a perfect probability. Traders disagree, have different amounts to trade with and feel differently about risk. Economists have shown that a price can only partly reveal what traders believe on average (Manski, 2006). For most realistic cases, though, prices end up close to the average belief (Wolfers & Zitzewitz, 2006). Treat the price as an approximate consensus.
What happens when you buy "Yes" or "No"?
You pay the current price per share. If your side is right, every share pays $1; if it is wrong, you lose what you paid. Here is what $100 buys in a hypothetical market at different prices, before fees:
| Price of "Yes" | Implied probability | Shares for $100 | You receive if "Yes" | Profit if "Yes" | Result if "No" |
|---|---|---|---|---|---|
| 10¢ | 10% | 1,000 | $1,000 | $900 | −$100 |
| 25¢ | 25% | 400 | $400 | $300 | −$100 |
| 50¢ | 50% | 200 | $200 | $100 | −$100 |
| 75¢ | 75% | 133 | $133 | $33 | −$100 |
| 90¢ | 90% | 111 | $111 | $11 | −$100 |
Cheap shares pay more when they are right, but they are right less often. If the price is a fair probability, the expected result before fees is zero at any price. You only come out ahead on average when you know something the price doesn't.
You also don't have to wait for the result. Say you bought 200 shares at 50¢ and the price rises to 70¢ after good news. You can sell for $140 and keep a $40 gain before fees. If the price falls to 30¢, selling returns $60. Either way, the most you can lose is what you paid.
Buying "No" works the same way in reverse: a "No" share at 37¢ pays $1 if the event does not happen.
Who is on the other side of your trade?
Other traders. In an order-book market, every share you buy is sold to you by another participant. Buyers post the prices they are willing to pay, sellers post the prices they will accept, and a trade happens when the two meet. The platform matches orders and charges a fee. It does not take the other side of your position, so it has nothing to gain from any particular outcome.
That sets a prediction market apart from fixed-price products, where the operator sets the price and takes the opposite side. Here the price comes from the participants.
There are two ways to trade:
- A market order buys or sells right now at the best available price. You take liquidity from the order book.
- A limit order names your price and waits until someone accepts it. You add liquidity.
How much a trade moves the price depends on liquidity. In an active market, a $100 order barely moves it; in a thin market, the same order can move it by several points. Before reading too much into a number, check the spread and how much trading the market has seen.
How is the outcome decided?
By the market's own rules, published before trading starts. The rules spell out the exact wording, the deadline, the source that counts (an official result, a league's final score, a government statistics release) and what happens in unusual situations.
On Melbo, outcomes are reported by a decentralized oracle according to these rules. Anyone can dispute a proposed result during the dispute window. Once the result is final, winning shares pay $1 and losing shares pay $0 automatically, through smart contracts on the Polygon blockchain.
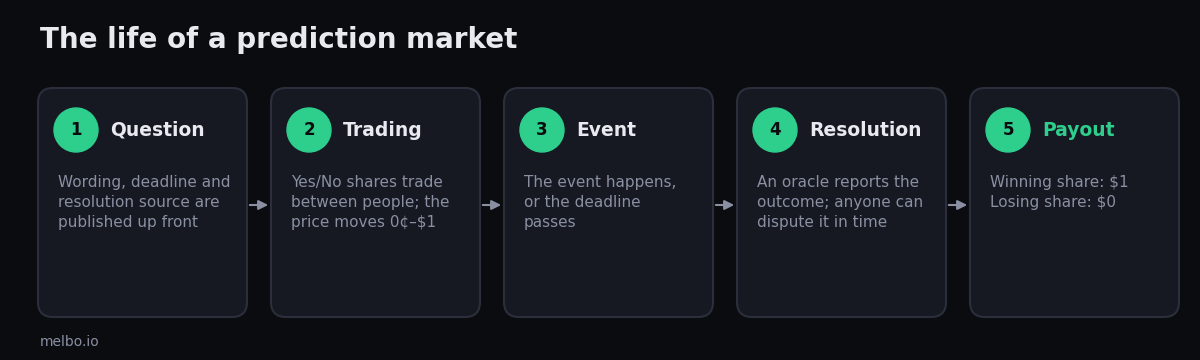
Three details are worth checking in the rules. First, cancelled or postponed events: the rules say whether the market resolves "No", waits for a new date, or settles at 50¢ per share. Second, the exact wording: "Will the price reach $X this year?" (any moment counts) and "Will the price be above $X on December 31?" (only the final day counts) are different questions with different prices. Third, the source: if the named source publishes something unclear or wrong, the dispute process settles it.
How do prediction market platforms make money?
Mostly from trading fees. Melbo's model is a useful example because every part of it is published on the fees page:
- Platform fee: 1% of a market order. Limit orders pay no platform fee. This is Melbo's only revenue.
- Liquidity fee: charged on market orders only and paid to the liquidity providers of the underlying protocol, not to Melbo. The formula is category rate × price × (1 − price) × number of shares. Per share, it is highest at a price of 50¢ and falls towards 0¢ and $1.
- Deposits, withdrawals, payouts and limit orders are free, and the platform covers network gas.
Here is what that means for a $100 market order in a hypothetical crypto-category market (category rate 0.07):
| Price of "Yes" | Platform fee (1%) | Liquidity fee | Total fees | Profit if "Yes", after fees |
|---|---|---|---|---|
| 10¢ | $1.00 | $6.30 | $7.30 | $892.70 |
| 25¢ | $1.00 | $5.25 | $6.25 | $293.75 |
| 50¢ | $1.00 | $3.50 | $4.50 | $95.50 |
| 75¢ | $1.00 | $1.75 | $2.75 | $30.58 |
| 90¢ | $1.00 | $0.70 | $1.70 | $9.41 |
If you can wait, limit orders are the cheapest way to trade. And while the fee per share peaks at 50¢, $100 buys many more shares at low prices, so the total fee on a cheap long shot can be higher than on a coin-flip market.
Are prediction markets accurate?
Often, though not perfectly, and their mistakes follow known patterns.
The best-known long-run test comes from the Iowa Electronic Markets, a research market run by the University of Iowa. Researchers compared its election forecasts with 964 national polls across five U.S. presidential elections from 1988 to 2004. The market was closer to the final result 74% of the time, and its advantage was largest more than 100 days before the vote (Berg, Nelson & Rietz, 2008). A group of leading economists, including Nobel laureate Kenneth Arrow, wrote in Science that the ability of groups to make predictions this way is "a potent research tool" (Arrow et al., 2008).
To judge accuracy, look at calibration: of all the outcomes a market priced around 70%, about 70% should actually happen. A single market at 90% that ends "No" doesn't prove the market was wrong, because a 90% chance still fails one time in ten.
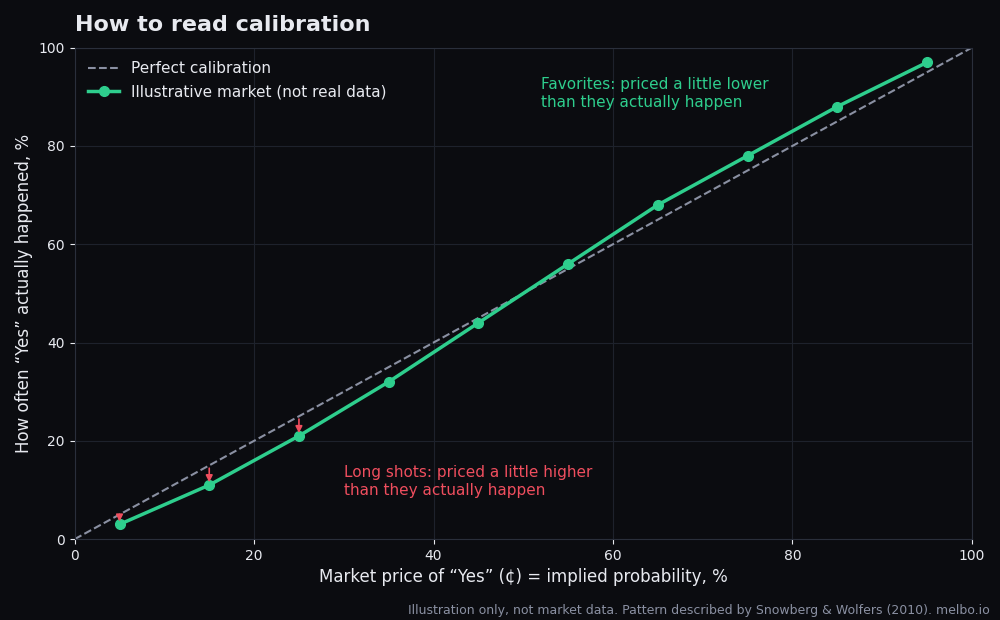
Researchers have also found a consistent tilt called the favorite-longshot bias. Low-probability outcomes tend to trade a little above their real chance, and strong favorites a little below. The effect is well documented in horse-racing markets, and the leading explanation is that people overweight small probabilities (Snowberg & Wolfers, 2010). In practice, an outcome priced at 5¢ may be less likely than 5%.
Accuracy also depends on activity. Markets with few traders, or ones that a single large order can move, are less reliable than busy ones.
Prediction markets vs polls vs expert forecasts
| Method | What it measures | Strengths | Weaknesses |
|---|---|---|---|
| Prediction market | A price set by traders with money at stake | Updates within minutes; combines many sources of information | Thin markets can be moved by a few orders; prices include traders' attitudes to risk |
| Opinion poll | What a sample of people say today | Transparent method; measures opinion directly | A snapshot of today; sampling and turnout errors |
| Expert or statistical model | Specialists' judgment or a model built on history | Explains why; uses long track records | Updates slowly; experts can share the same blind spots |
None of them is right every time. The clearest picture comes from reading them together and asking why they disagree when they do.
What are the risks?
- You can lose the full amount you put into a position, because a share can fall to $0.
- Thin markets and wide spreads make it costly to get in or out.
- The answer depends on the market's exact wording and source, so read the rules before trading.
- Prediction markets are regulated differently in different countries. Melbo is for adults and is not available in restricted jurisdictions; the current list is in the Terms of Service, section 3.2.
- Melbo is non-custodial. Funds sit in your own wallet as USDC on Polygon, so keep access to your sign-in methods or export your key.
Common mistakes when reading a prediction market
- Treating 90% as certain. A 90% outcome still fails about one time in ten, and over many markets those misses are expected.
- Forgetting fees on cheap shares. A long shot at 5¢ looks like it could turn $5 into $100, but fees and the favorite-longshot bias both work against it. Check the after-fee result before you compare prices.
- Skipping the wording. "By the end of the year" and "on December 31" are different questions, and so are "announced" and "completed". The rules decide the outcome.
- Reading a jump in a quiet market as news. In a thin market, one order can move the price several points. Check whether other traders followed before you treat the move as information.
- Confusing the price with the payout. You pay the price, and a winning share always pays $1, so a share bought at 80¢ can make at most 20¢ before fees.
- Ignoring the date. A probability from last week may be stale, so look for the "as of" time.
How to read a probability chart
- Check the level and the time stamp. "62%" means little without "as of when".
- Look for jumps, then look for the news. A sudden move usually follows an announcement, a result or a data release at that moment.
- Check the spread and activity. A big move in a quiet market can come from a single order.
- Re-read the rules to make sure the chart answers the question you think it does.
When we chart a market, we mark each turning point with its date and the news behind it.
Frequently asked questions
Can I lose more than I put in?
No. When you buy shares, the most you can lose is what you paid for them plus fees. A share's price can't go below $0, and there is no borrowing involved.
What happens if I sell before the event ends?
You receive the current market price for your shares. If the price has risen since you bought, you lock in a gain. If it has fallen, you take a smaller loss than if the outcome went fully against you. You don't need to wait for the result.
What does a price of 50¢ mean?
The market sees the outcome as a coin flip, about a 50% chance. It is also the price at which the liquidity fee per share is highest, so limit orders save the most here.
What happens if the event is cancelled?
It depends on the market's rules, which are published before trading starts. A market may resolve "No", wait for a rescheduled date, or settle each share at 50¢. Check the rules of the specific market.
Do I need a crypto wallet to use a prediction market?
On Melbo, no setup is needed. A wallet is created when you sign in with email, Google or Telegram, and it belongs to you. Balances are in USDC on the Polygon network, and network gas is covered. You can export the private key at any time.
How do prediction markets make money?
Through trading fees. On Melbo, market orders pay a 1% platform fee plus a liquidity fee that goes to the protocol's liquidity providers. Limit orders, deposits, withdrawals and payouts are free.
Are prediction markets legal?
It depends on the country. Some countries allow them, some restrict them and some block access. Melbo is not available in restricted jurisdictions listed in its Terms of Service, and it is only for adults.
How are prediction market payouts taxed?
Tax treatment depends on where you live and on your personal situation. This article is not tax advice. Keep a record of your trades and check your local rules or speak to a tax adviser.
How we wrote this
All market examples in this guide are hypothetical and are not current market prices. Fee figures come from melbo.io/en/fees as of 20 October 2026. Research findings are linked to their original papers. We update this guide when the mechanics or fees change.
Sources
- Wolfers, J., Zitzewitz, E. (2004). Prediction Markets. Journal of Economic Perspectives 18(2), 107-126. NBER working paper
- Manski, C. (2006). Interpreting the predictions of prediction markets. Economics Letters 91(3), 425-429. IDEAS/RePEc
- Wolfers, J., Zitzewitz, E. (2006). Interpreting Prediction Market Prices as Probabilities. NBER working paper w12200
- Berg, J., Nelson, F., Rietz, T. (2008). Prediction market accuracy in the long run. International Journal of Forecasting 24(2). IDEAS/RePEc
- Arrow, K. J., et al. (2008). The Promise of Prediction Markets. Science 320(5878), 877-878. DOI
- Snowberg, E., Wolfers, J. (2010). Explaining the Favorite–Long Shot Bias. Journal of Political Economy 118(4), 723-746. NBER working paper
See how markets price today's events: browse live markets on Melbo.