Did Prediction Markets Get the 2026 Midterms Right? 480 Races vs Polls and Results
A race-by-race check of prediction-market prices taken before voting began on November 3, 2026, against results, polling averages and forecast models: where the markets were right, where they missed, and what one election can prove.
Mostly yes on the big questions, and where they missed, they missed in the same direction as the polls. We saved Polymarket prices on November 3, 2026 at 09:53 UTC, before polls opened, and compared them with the results two days later. The markets gave Democrats a 94.5% chance of winning the House and 76.5% for the Senate; Democrats won both. Across 480 House, Senate and governor races decided by November 5, the market favorite won 460, or 95.8%. Every favorite priced at 90% or more won.
The close races tell a different story. Where the favorite was priced between 50% and 70%, it won only half the time, 15 of 30. And 19 of the 20 races the markets got wrong went the same way: a Republican favorite lost to a Democrat. In the 25 key Senate and governor races already called, the market favorite won 23 and the polling-average favorite won 20. The market was right in all three races where it disagreed with the polls, and wrong in the two where it followed them into a miss.
Data as of November 5, 2026, 12:17 UTC. Four key races are not called yet; we mark them. Polls and results are reported as published by the sources named below.
Did prediction markets get the 2026 midterms right?
On the questions most people asked, yes. Our snapshot of Polymarket on the morning of election day:
| Market | Price on Nov 3, 09:53 UTC | Result |
|---|---|---|
| Democrats win the House | 94.5% | Yes: AP called it early on Nov 4 |
| Democrats win the Senate | 76.5% | Yes: AP called it shortly before midnight on Nov 3 |
| Democrats win both chambers | 75.5% | Yes |
| Republican Senate, Democratic House | 18.5% | No |
Kalshi priced the same outcomes at similar levels: about 92% to 94% for a Democratic House and 73% to 75% for the Senate in the days before the vote. The forecasting models agreed on the direction: Silver Bulletin gave Democrats 80.1% for the Senate on November 1, and Race to the WH 79.4%.
Getting the winner of a 76% market right is not a strong test on its own: a 76% favorite loses one time in four. The better test is hundreds of races at once, which is what the rest of this article checks.
How accurate were prediction markets across all races?
We took 498 race markets from our snapshot (House seats, Senate and governor races) and checked each one on November 5. 443 had resolved. Another 37 were still trading but had moved above 97% or below 3%, so we count them as decided and show them separately in our data. 18 are still open and excluded.
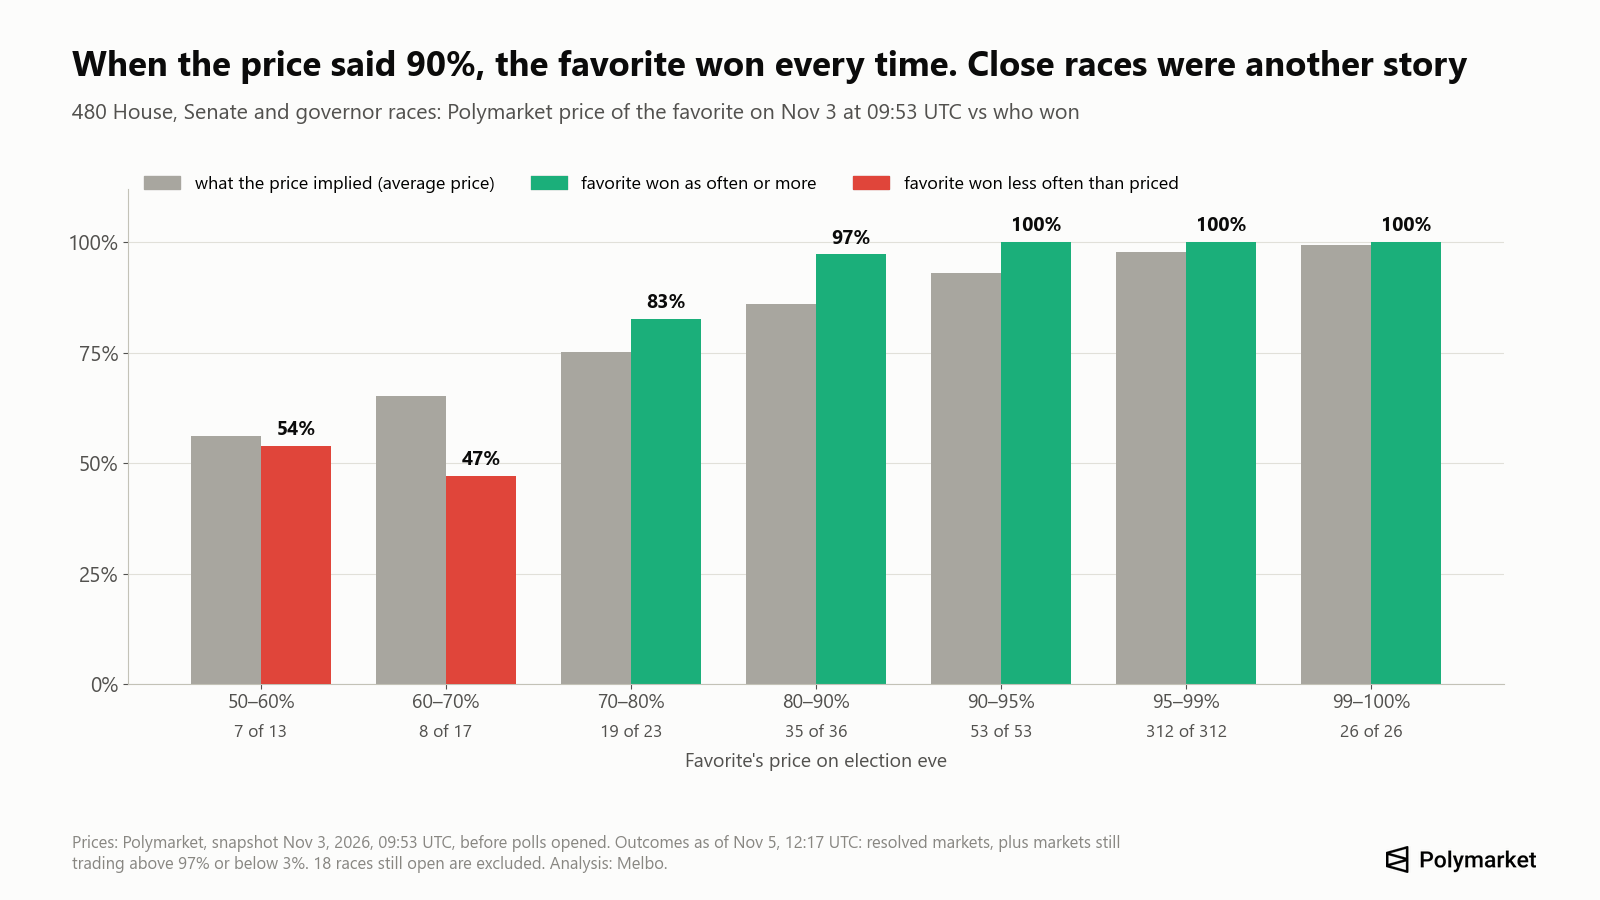
What the chart shows:
- Above 90%, the favorite won every race: 391 of 391.
- Between 80% and 90%, 35 of 36.
- Between 70% and 80%, 19 of 23 (83%), a little more often than the 75% the prices implied.
- Between 50% and 70%, the favorite won 15 of 30 (50%), against an average price of about 61%. These were the races where the market was least sure, and they are where it lost money for those who followed it.
The Brier score, a standard measure of forecast error where 0 is perfect and 0.25 is a coin toss, was 0.028 across the 480 races and 0.016 on the 443 that had formally resolved. Most of that low score comes from safe seats priced at 95% or more. On the 25 called key Senate and governor races, the market's Brier score was 0.078.
Academic work on prediction markets has found that political prices tend to sit too close to 50%, so strong favorites win a little more often than their price suggests (Le, 2026). Our 70% to 90% buckets fit that pattern. The 50% to 70% bucket did not, because almost all of its misses went in one direction.
Were prediction markets more accurate than polls in 2026?
In the key races, yes, but not by much, and mostly because the polls themselves were off. We compared the final polling average (the mean of the RealClearPolling, Decision Desk HQ and Silver Bulletin averages) with the result in 29 Senate and governor races.
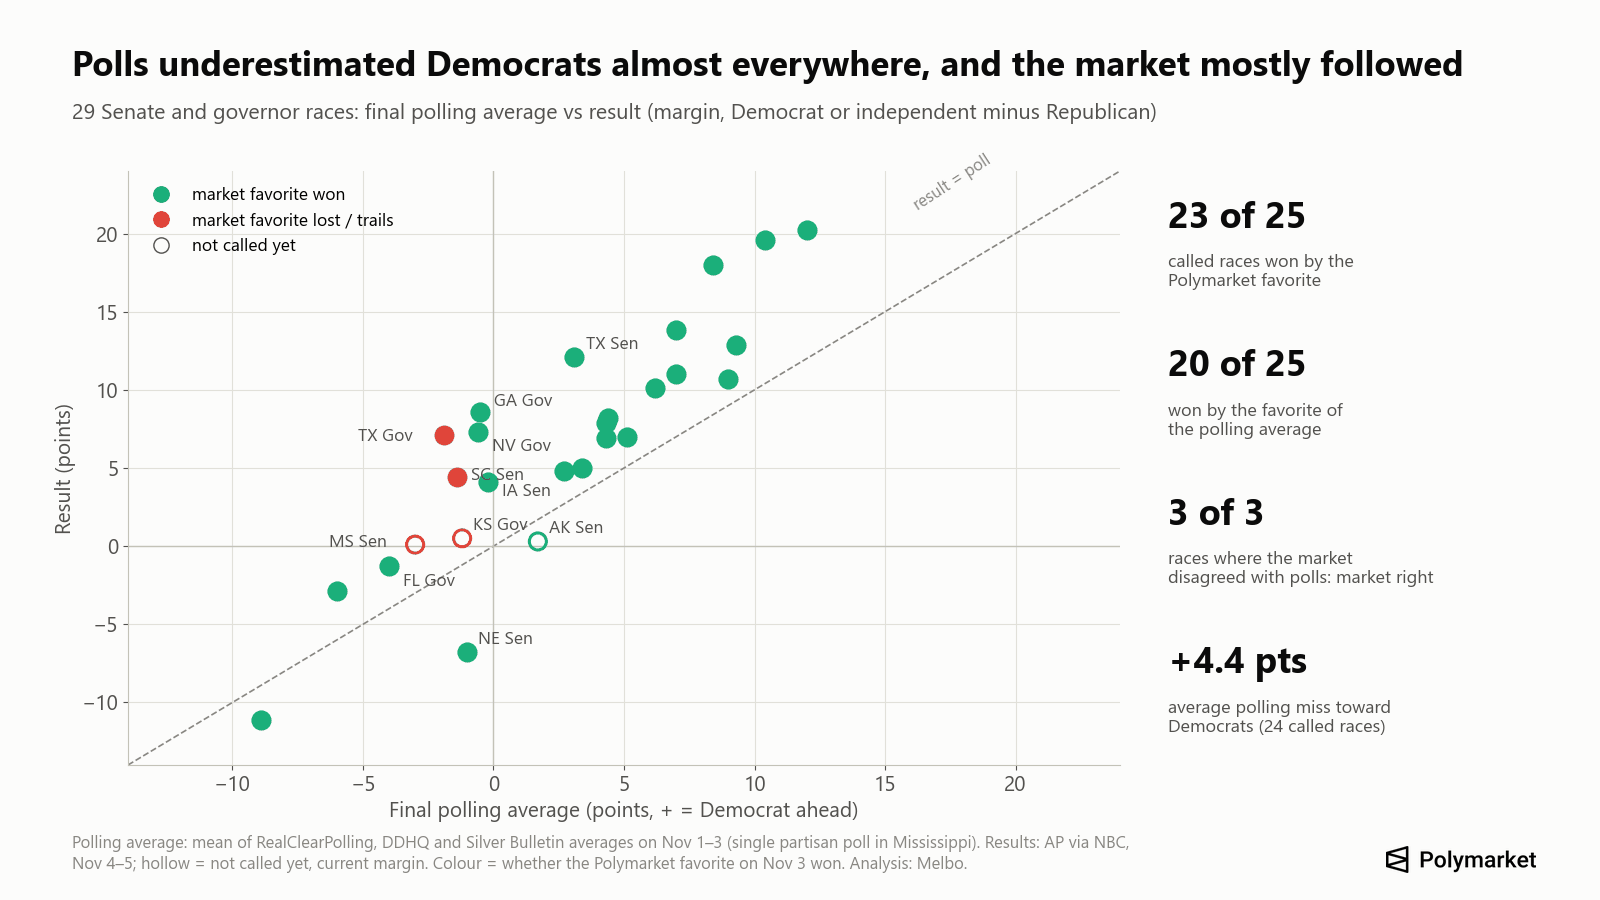
- The polls missed toward Democrats by 4.4 points on average in the 24 called races we could measure. The Democrat beat the polling average in all 22 races with a Democratic candidate; the independents in Nebraska and Montana did worse than theirs. In Texas the polling average had Talarico ahead by about 3 points; he won by 12.
- The market favorite won 23 of 25 called races; the polling-average favorite won 20.
- Where the market broke with the polls, it was right every time: the Iowa Senate race (polls split, market 52.5% for Turek, who won by 4.1 points), the Nevada governor race (polls slightly favored Lombardo, market 76.5% for Ford, who won by 7.3) and the Georgia governor race (polls about even, market 73% for Bottoms, who won by 8.6).
- Where the market followed the polls, it missed with them: the South Carolina Senate race (Graham Nordone 69.5%; Andrews won by 4.4) and the Texas governor race (Abbott 62%; Hinojosa won by 7.1).
Every key race: polls, market and result
Margins in points; ✓ = the Polymarket favorite won, ✗ = it lost. California's count was 61% complete when we checked.
| Race | Polling average | Polymarket favorite, Nov 3 | Result |
|---|---|---|---|
| Texas Senate | Talarico +3.1 | Talarico 74.5% | Talarico +12.1 ✓ |
| Michigan Senate | El-Sayed +5.1 | El-Sayed 80.5% | El-Sayed +7.0 ✓ |
| Maine Senate | Jackson +4.3 | Jackson 73.5% | Jackson +6.9 ✓ |
| Ohio Senate (special) | Brown +2.7 | Brown 71.5% | Brown +4.8 ✓ |
| Alaska Senate | Peltola +1.7 | Peltola 71.5% | not called (Peltola +0.3) |
| Nebraska Senate | Ricketts +1.0 | Ricketts 68.5% | Ricketts +6.8 ✓ |
| Kansas Senate | Hamilton +3.4 | Hamilton 62.5% | Hamilton +5.0 ✓ |
| Iowa Senate | Hinson +0.2 | Turek 52.5% | Turek +4.1 ✓ |
| South Carolina Senate | Graham Nordone +1.4 | Graham Nordone 69.5% | Andrews +4.4 ✗ |
| North Carolina Senate | Cooper +10.4 | Cooper 97.8% | Cooper +19.6 ✓ |
| Georgia Senate | Ossoff +8.4 | Ossoff 97.2% | Ossoff +18.0 ✓ |
| New Hampshire Senate | Pappas +7.0 | Pappas 94.5% | Pappas +13.8 ✓ |
| Minnesota Senate | Flanagan +6.2 | Flanagan 91.5% | Flanagan +10.1 ✓ |
| Mississippi Senate | Hyde-Smith +3.0 | Hyde-Smith 86.5% | not called (Colom +0.1) |
| Florida Senate (special) | Moody +6.0 | Moody 85.5% | Moody +2.9 ✓ |
| Montana Senate | Alme +8.9 | Alme 90.5% | Alme +11.1 ✓ |
| California Governor | Becerra +21.4 | Becerra 98.2% | Becerra +28.4 ✓ |
| Texas Governor | Abbott +1.9 | Abbott 62% | Hinojosa +7.1 ✗ |
| Ohio Governor | Acton +4.3 | Acton 83.5% | Acton +7.9 ✓ |
| Florida Governor | Donalds +4.0 | Donalds 63.5% | Donalds +1.3 ✓ |
| Nevada Governor | Lombardo +0.6 | Ford 76.5% | Ford +7.3 ✓ |
| Georgia Governor | Jackson +0.5 | Bottoms 73% | Bottoms +8.6 ✓ |
| Arizona Governor | Hobbs +9.3 | Hobbs 93.5% | Hobbs +12.9 ✓ |
| Wisconsin Governor | Crowley +4.4 | Crowley 85.5% | Crowley +8.2 ✓ |
| Michigan Governor | Benson +9.0 | Benson 95.2% | Benson +10.7 ✓ |
| Kansas Governor | Masterson +1.2 | Masterson 65.5% | not called (Holscher +0.5) |
| Iowa Governor | Sand +7.0 | Sand 88.5% | Sand +11.0 ✓ |
| Alaska Governor | Kreiss-Tomkins +8.7 | Kreiss-Tomkins 89.2% | not called (Kreiss-Tomkins leads first round) |
| New York Governor | Hochul +12.0 | Hochul 96.4% | Hochul +20.2 ✓ |
So the honest summary is this: markets added information in a few close races, but they did not escape the main error of 2026, which was a polling miss toward Democrats. In 2022 the error ran the other way, when markets priced a Republican wave that did not come.
Which races did Polymarket and Kalshi get wrong?
Among the 480 decided races, 20 favorites lost. All but one were Republicans.
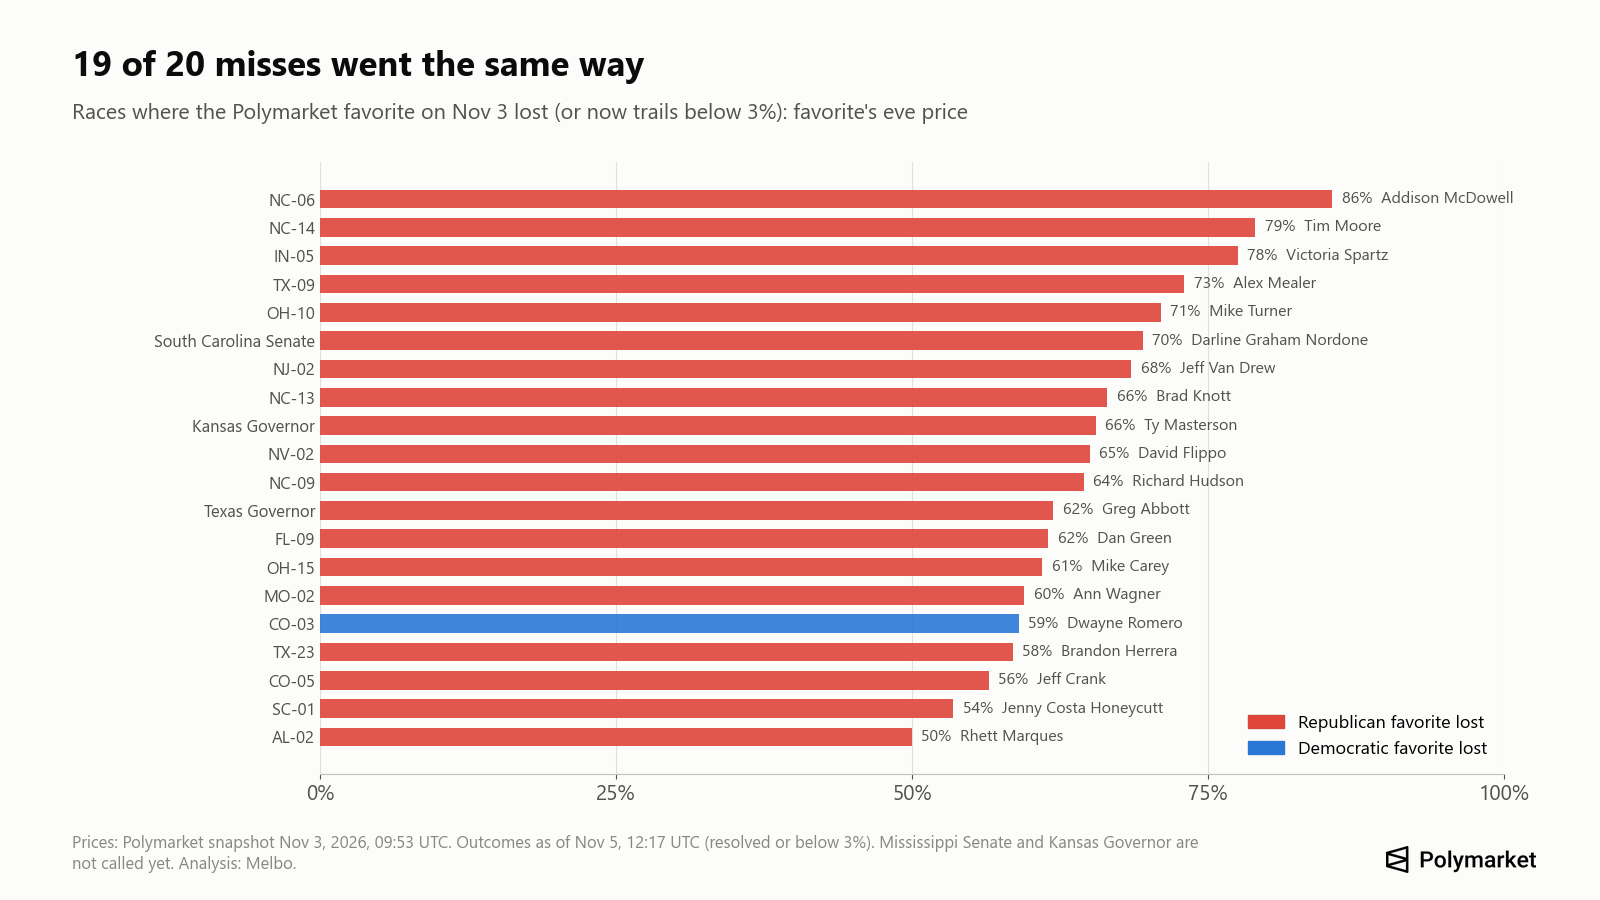
The largest misses by price were House seats: NC-06 (the Republican was priced at 86%), NC-14 (79%), IN-05 (78%) and TX-09 (73%). In the Senate the South Carolina race was the one confirmed miss. Two more are likely but not called: in Mississippi, Senator Hyde-Smith was priced at 86.5% and now trails Colom by 1,138 votes, and in Kansas the Republican governor candidate Masterson was priced at 65.5% and trails Holscher by about half a point.
Kalshi made the same calls in the races that mattered most: its favorites were Abbott in Texas and Graham Nordone in South Carolina too.
Prediction markets vs election models: who did better?
It depends on what you score. The one independent scoring we found, by FiftyPlusOne on November 5, gave the best Senate-control forecast to the Silver Bulletin model (Brier 0.032), ahead of Polymarket (0.056) and Kalshi (0.060). Across 421 House races, the two markets scored best of all forecasters (0.026), with Silver Bulletin at 0.030 (FiftyPlusOne). FiftyPlusOne also publishes its own model, which it scored in the same table.
The race ratings show a similar picture in our 25 called key races. Silver Bulletin's ratings named a favorite in 23 and got 21 right, missing South Carolina and the Texas governor race like the market. Cook Political Report named a favorite in 18 and got 16 right; it rated seven of the races as toss-ups. The market always names a favorite, which is why it can be scored on every race, but that also means some of its "favorites" were close to a coin flip.
What does "98% accurate" mean for a prediction market?
After the vote, both platforms published headline numbers. Kalshi said its favorite won 479 of 487 races, and Polymarket said 419 of 426 resolved outcomes went to its favorite, 98.4%. Both figures are counts of how often the favorite won, and both are true in the sense that our own count is similar.
But most of those races were never in doubt. In our data, 391 of the 480 favorites were priced at 90% or more, and favorites at 95% or above are expected to win about 98% of the time. A count of favorites who won says little about whether a price of 65% meant 65%. That is what calibration measures, and it is where the 2026 markets were weakest.
How fast did prediction markets react on election night?
Very fast, by the platforms' own account. Polymarket said its markets reached 99% in 10 key races a median of 31 minutes before CNN, Fox News or the AP called them. Speed is not the same as foresight: by then votes were being counted, and the markets were reading the same county results as the news desks. The forecast that matters is the price before the first vote is counted, which is the one we use.
Which races are still undecided, and how will the markets settle?
As of November 5, four of the 29 key races had not been called:
- Alaska Senate: Peltola leads Sullivan by 637 votes in the first round; the ranked-choice count is on November 18.
- Alaska governor: Kreiss-Tomkins has 49.1% in the first round, while three Republican candidates together have about 51%, so the ranked-choice count can change the order.
- Mississippi Senate: Colom leads Hyde-Smith by 1,138 votes, and the AP says it is too early to call.
- Kansas governor: Holscher leads Masterson by about half a point, which triggers an audit; a recount is possible.
Polymarket settles state races when the AP, Fox News and NBC have all called the same winner; if they don't, it waits for certification. That is why some markets were still trading at 95% to 99% on November 5 even though the outcome looked clear.
Can one election prove prediction markets are accurate?
No. One night gives a few hundred correlated races, and correlated is the key word: when polls miss in one direction, every close race misses together, as 2026 showed. The record across elections is mixed. In 2022 the markets expected a Republican wave that did not happen. In 2024 they were closer to the result than most models. In Brazil's presidential runoff in October 2026, the market favorite at about 80% lost.
What 2026 does show is narrower and still useful. Prices above 80% were reliable this year. Prices between 50% and 70% were not much better than a coin toss, and when markets and polls agreed in a close race, that agreement was not extra evidence: they were often reading the same polls.
What this means if you follow prediction markets
- Read a price as a probability, not a call. A 65% favorite is expected to lose one time in three, and in 2026 it lost more often than that.
- Watch where the market disagrees with the polls. In 2026 those were the races where the market added the most.
- Check the resolution rules before an election, not after. Close races can take weeks to settle, and each platform has its own rules for recounts and ranked-choice counts. Our guide to how prediction markets work explains how price, probability and payout fit together.
- Expect one-directional errors. When the national environment is misjudged, many close races miss together.
How we did this
We downloaded every open Polymarket event tagged for the 2026 midterms through Polymarket's public Gamma API on November 3, 2026 at 09:53 UTC, before polls opened on the East Coast. For each race we took the price of the leading outcome. On November 5 at 12:17 UTC we checked every market again: resolved markets count as decided, and so do markets still trading above 97% or below 3%. We excluded placeholder outcomes, lieutenant governor races and territories, which leaves 498 races, of which 480 are decided.
For the 29 key Senate and governor races, the polling average is the mean of the RealClearPolling, Decision Desk HQ and Silver Bulletin averages as listed on the race pages on November 1 to 3 (Mississippi had only one partisan poll). Ratings are Cook Political Report and Silver Bulletin; results are AP counts as reported on November 4 and 5. Margins can still change as counting continues.
Frequently asked questions
Did prediction markets predict the 2026 midterms correctly?
On control of Congress, yes: Polymarket priced a Democratic House at 94.5% and a Democratic Senate at 76.5% on election morning, and both happened. Across 480 races, the market favorite won 95.8% of the time.
Were prediction markets more accurate than polls in 2026?
In 25 called key Senate and governor races, the market favorite won 23 and the polling-average favorite won 20. Both underestimated Democrats, who beat their polls by 4.4 points on average.
Which races did prediction markets get wrong in 2026?
20 favorites lost, 19 of them Republicans, including the South Carolina Senate race, the Texas governor race and House seats such as NC-06, NC-14 and IN-05. Mississippi's Senate race and the Kansas governor race may be added once they are called.
Was Kalshi or Polymarket more accurate in 2026?
Almost the same. Their prices for control of Congress were within a few points of each other, they had the same favorites in the key misses, and FiftyPlusOne scored them 0.056 (Polymarket) and 0.060 (Kalshi) on Senate control and 0.026 each on House races.
What is a Brier score?
It is the average squared difference between a forecast probability and what happened, scored 1 or 0. Zero is a perfect forecast, 0.25 is what you get by saying 50% every time, and lower is better.
Why did markets miss South Carolina and Texas?
In both races the market favored the same candidate as the polls and the forecasters, and the polls underestimated the Democrat by 6 to 9 points. The market had no information that pointed the other way.
When will the Alaska and Mississippi Senate races be settled?
Alaska's ranked-choice count is scheduled for November 18. Mississippi's race is too close to call; the market settles once the AP, Fox News and NBC agree on a winner, or at certification.
What to do next
If you are new to prediction markets, our guide to how prediction markets work explains price, probability and payout, and our report on insider trading cases covers what can distort a price. To trade prediction markets with your own funds, you can start on Melbo from $1.