Polymarket Volume Explained: Where the Money Goes and What Thin Markets Cost You
A snapshot of every open Polymarket market and order book on November 6, 2026: why a TV show topped the weekly volume ranking in election week, how concentrated trading really is, and what a $100 or $1,000 order costs in a thin market.
Into very few markets. On November 6, 2026 we downloaded every open market on Polymarket, 262,071 of them in 20,156 events, and the order book of each one. In the seven days before, 92.8% of those markets had no trades at all, and 82.6% had never traded since they were listed. The top 1% of them took 94.9% of their weekly volume, and only 20 traded more than $1 million.
Even the headline numbers need a second look. In election week, Polymarket's public data, sorted by 7-day volume, put a TV show on top: $19.4 million for "New Stranger Things episode released by...?". $19.31 million of that was trading from January 2026 that the weekly figure never dropped. The show's markets actually traded about $95,000 that week. Meanwhile the election markets that settled after November 3 traded $94.4 million in three days and now show a weekly volume of zero.
For a trader, thin trading is a cost you pay on the way in and again on the way out. Buy $100 at market in a typical open market that traded under $1,000 that week, sell it straight back, and you get about $73. In markets that traded over $100,000, you get about $96. For a $1,000 order the gap is $393 against $915, and in 28% of the small markets the order book could not take $1,000 at all.
Data: Polymarket public APIs, snapshot of November 6, 2026, 13:42 UTC, compared with our election-day snapshot of November 3, 09:53 UTC. Kalshi data from its public API at 13:46 UTC the same day. Method at the end.
Did a TV show really out-trade the 2026 midterms on Polymarket?
No. The event "New Stranger Things episode released by...?" is a ladder of date markets created on January 5, 2026, when a fan theory said a secret ninth episode would appear on January 7. That market, "by Wednesday", traded $15.18 million in less than three days and closed on January 8, 2026. It resolved "No".
Ten months later, Polymarket's data still counted its trading as weekly volume. On November 6, the event's 7-day volume read $19,404,883:
| Part of the event | 7-day volume shown | Status |
|---|---|---|
| "by Wednesday" (January 7, 2026) | $15,181,604 | closed January 8, 2026 |
| "by January 31" | $2,939,233 | closed February 1, 2026 |
| "by January 14" | $1,005,437 | closed January 15, 2026 |
| "by February 28" | $183,418 | closed March 1, 2026 |
| "by December 31, 2026" (open) | $95,191 | trading |
| Event total | $19,404,883 | 99.5% from closed markets |
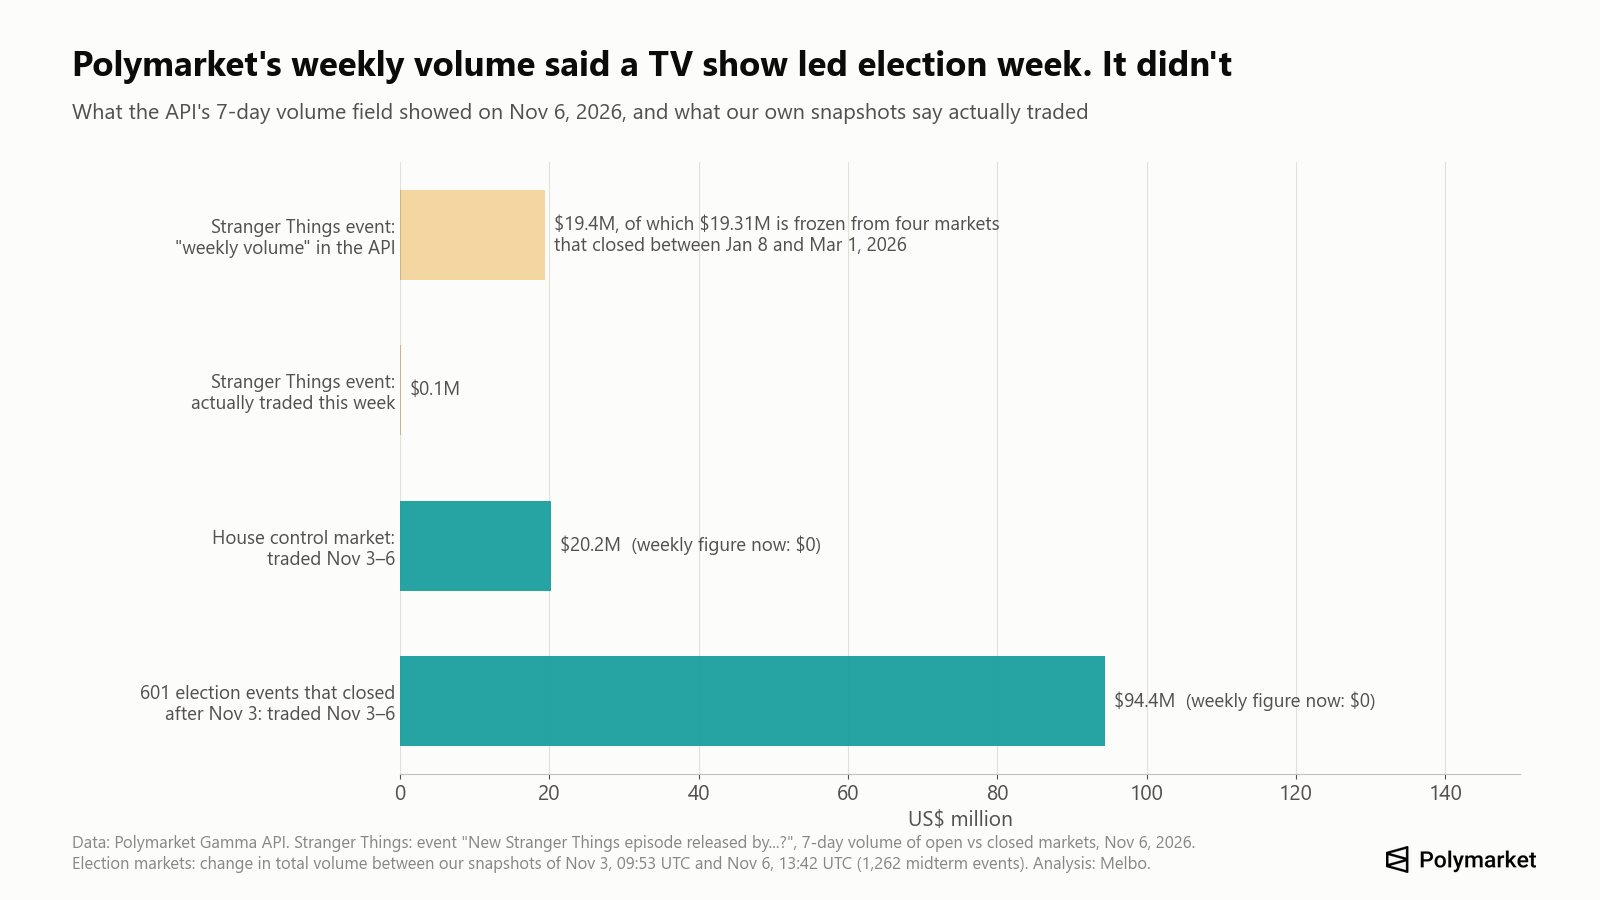
The opposite happens to markets that close during the week. We saved prices and volumes of 1,262 election events on the morning of November 3. By the afternoon of November 6 they had traded another $126.6 million. $94.4 million of that came from 601 events that have since closed, and they now show a weekly volume of $0. "Which party will win the House in 2026?" alone traded $20.2 million in those three days.
So a ranking by Polymarket's weekly field can be wrong in both directions: it keeps volume from markets that closed months ago, and it drops markets that closed this week. We found 29 open events carrying more than $100,000 of frozen weekly volume, $30.8 million in total. Two crypto examples: "Will MetaMask launch a token by ___ ?" showed $915,621 for the week but traded $1,613; "Pump.fun airdrop by ....?" showed $506,591 and traded $251.
The real busiest open event of the week was "Which Senate Swing States will Republicans win? (Build Your Map)" with $11.9 million, followed by the three 2028 presidential markets at about $10 million each and "Fed Decision in December?" at $6.9 million.
Pop culture did have its moment, in January: the "by Wednesday" and "by January 31" markets traded $25.8 million between them, about 83% of the event's lifetime volume of $31.1 million.
What does "volume" mean on Polymarket?
Volume is the value of trades over a period. It measures activity, not money put in: the same $100 can be traded back and forth many times. Kalshi counts contracts traded, each at its $1 face value. When the Washington Post counted midterm trading on both platforms, it used that notional measure and called it "a measure of overall trading activity, not of how much money traders put into the market" (Washington Post via The Detroit News).
Four things make volume numbers hard to compare:
- Who is counted. Kalshi reports contracts traded, one side of each trade. A CNBC analysis in July 2026 said Polymarket's API counts both sides; Polymarket says it does not double count (Cointelegraph). In December 2025, Paradigm showed that dashboards summing Polymarket's on-chain fills counted each trade twice (Paradigm). Paradigm is an investor in Kalshi.
- Wash trading. A Columbia University study estimated that about 25% of Polymarket volume over three years, roughly $4.5 billion, was likely wash trading, with a peak near 60% of weekly volume in December 2024 (SSRN).
- Time windows. As shown above, weekly and monthly fields can include markets that closed long ago and miss markets that closed this week.
- Event vs outcome. An event's volume is the sum of all its markets. "Fed Decision in December?" traded $6.9 million, but that is spread across several outcomes, and the one you want to trade may be thin.
In this article we use each market's lifetime volume, its 7-day volume only while it is open, and the change in lifetime volume between our own snapshots.
Where does prediction market volume actually go?
Into markets that last a few days, and into a few hundred big ones. Between October 30 and November 6, 2026, we can measure $620.5 million of Polymarket trading exactly: the 7-day volume of the 262,071 markets still open on November 6, plus the full volume of 155,351 markets that opened and closed within the week. 68.8% of that money went to markets that lived less than a week: single games and maps, and 20,470 "Up or Down" windows on crypto prices, which alone traded $113.5 million.
Across those 417,422 markets, the top 1% took 87.6% of the volume, and the top 0.1%, 417 markets, took 52.1%. 86.3% of the markets traded nothing at all, and only 71 traded $1 million or more. Another 132,875 markets opened earlier and closed during the week, including the election control markets. We leave them out of these totals because their lifetime volume cannot be split by week; the election markets alone traded at least $94.4 million on November 3 to 6.
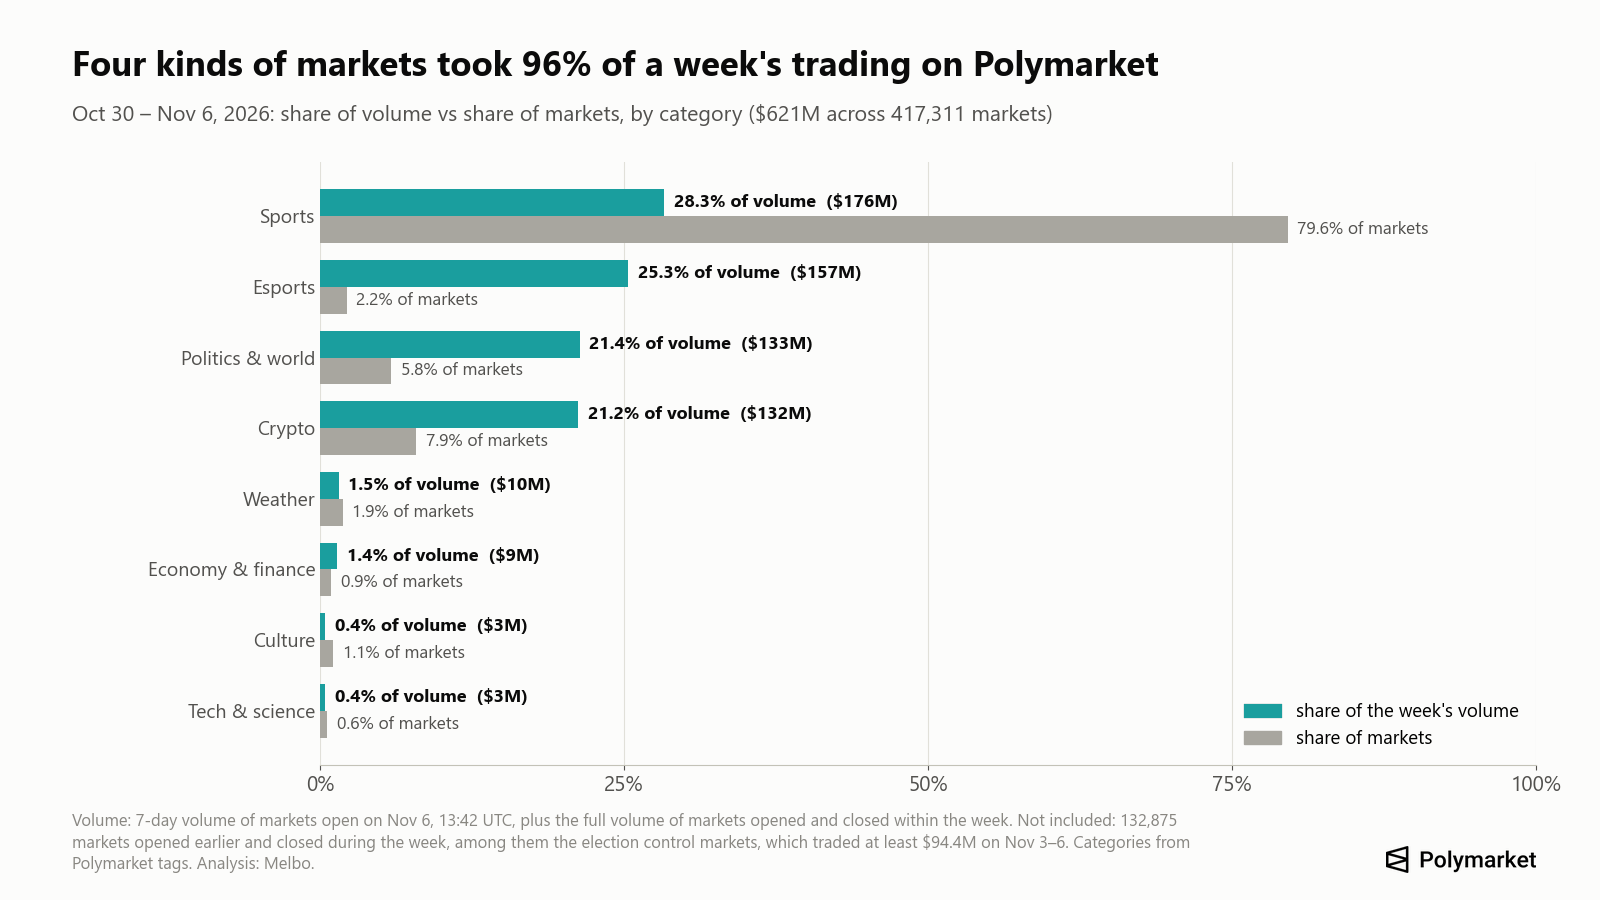
Four groups took 96% of the week's volume:
- Sports, 28.3%, from 79.6% of all markets. Most of those markets are player props and lines under each game that nobody trades.
- Esports, 25.3%, from 2.2% of markets. The League of Legends world championship playoffs ran that week, and the market on game 1 of Dplus KIA vs Bilibili Gaming alone traded $6.2 million.
- Politics and world affairs, 21.4%, and more once the closed election markets are added.
- Crypto, 21.2%, mostly the short "Up or Down" price windows.
Culture, the category of the Stranger Things market, took 0.4%.
Other studies found the same shape. PANews, looking at 295,000 Polymarket markets in January 2026, found that markets above $10 million held 47% of all volume (PANews via AiCoin). CNBC's analysis of closed Polymarket markets from 2021 to May 2026 found that about 70% traded under $10,000 (CNBC).
How many Polymarket markets barely trade?
Most of them. Of the 262,071 open markets on November 6:
| Open markets, Nov 6, 2026 | Count | Share |
|---|---|---|
| No trades in the past 7 days | 243,121 | 92.8% |
| No trades in the past 24 hours | 243,150 | 92.8% |
| Never traded since listing | 216,476 | 82.6% |
| Under $1,000 in the past 7 days | 256,173 | 97.7% |
| Over $1 million in the past 7 days | 20 | 0.008% |
Two things explain the empty markets. First, many are generated in bulk: a single NFL or NBA game carries around 300 markets for spreads, totals and player statistics, and most of them sit untouched until game day. Sports accounted for 81.7% of open markets but 12.7% of the volume in open markets. Second, many are new: 113,945 open markets, 43.5%, were listed in the past seven days.
The picture matches earlier counts. CNBC found more than 45,000 closed Polymarket markets with zero volume. Evercore ISI found that only 8% of markets on Polymarket and Kalshi ever reached $1 million. For the 2026 congressional races, the Anti-Corruption Data Collective (ACDC) counted in August that 87% of markets were under $10,000 or held by very few traders (ACDC).
What does a thin market cost you?
The spread and the depth of the order book. When you buy at market, you pay the best ask, and if the order is bigger than the shares on offer at that price, you keep buying at higher prices. We pulled the order book of every open market that accepts orders and checked what happens if you buy YES at market for $100 or $1,000 and sell the shares straight back, grouped by how much the market traded in the past week.
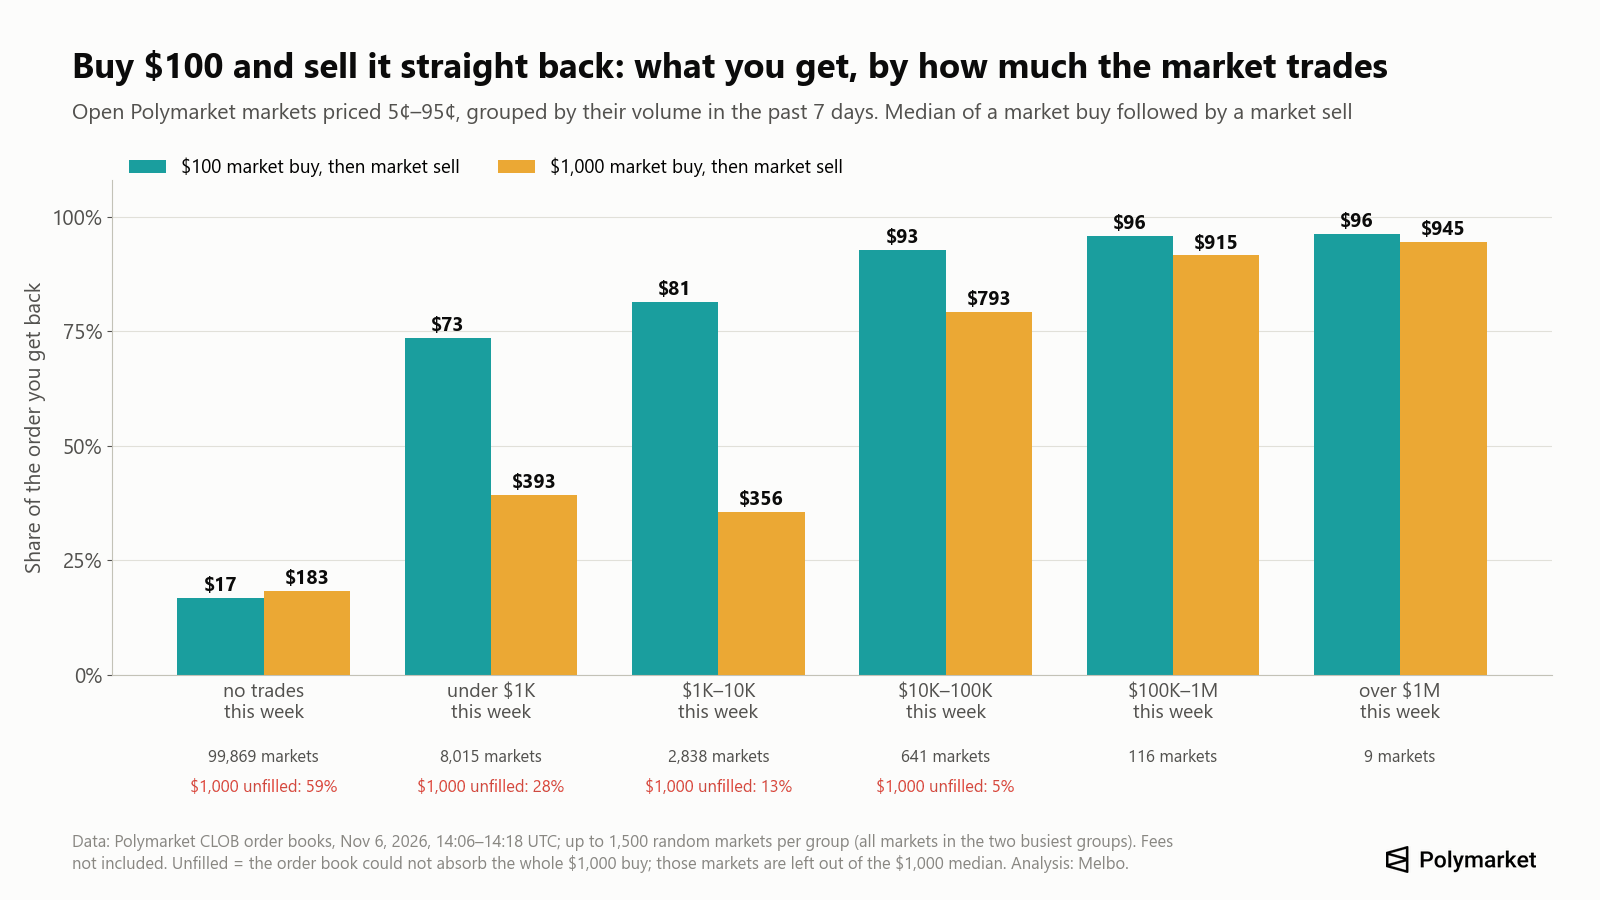
| Volume in the past 7 days | Markets priced 5¢–95¢ | Median spread | Spread over 10¢ | Median $ to move price 5¢ | $100 buy and sell: back | $1,000 buy and sell: back | $1,000 order can't fill |
|---|---|---|---|---|---|---|---|
| No trades | 99,869 | 54¢ | 68% | $0 | $17 | $183 | 59% |
| Under $1,000 | 8,015 | 4¢ | 30% | $71 | $73 | $393 | 28% |
| $1,000 to $10,000 | 2,838 | 3¢ | 15% | $166 | $81 | $356 | 13% |
| $10,000 to $100,000 | 641 | 1¢ | 8% | $1,316 | $93 | $793 | 5% |
| $100,000 to $1 million | 116 | 1¢ | 0% | $8,721 | $96 | $915 | 0% |
| Over $1 million | 9 | 1¢ | 0% | $21,474 | $96 | $945 | 0% |
What the table shows:
- In markets with no trades that week, the book is often a placeholder. The median spread is 54¢, and 22% of these books are just a bid at 1¢ or 2¢ and an offer at 98¢ or 99¢. A market buy there fills at whatever the offer is, so $100 in and out returns a median of $17.
- Small but active markets are cheap for small orders and expensive for large ones. Under $1,000 of weekly volume, a $100 round trip returns $73, but $1,000 returns $393, because the order eats through several price levels on the way in and again on the way out.
- The cost falls fast with volume. From $10,000 a week the median spread is 1¢; above $100,000, a $1,000 round trip returns more than $900.
- Cheap shares magnify the spread. Even in a busy market, a 1¢ spread on a 9¢ share is 11% of the price: in "Will Bitcoin dip to $60,000 in November?", with a bid of 8¢ and an ask of 9¢, $100 bought and sold at once returned $88.89.
One more trap: the probability you see. Polymarket shows the midpoint between the best bid and ask, but if the spread is wider than 10¢, it shows the last traded price instead (Polymarket Help Center). On November 6, 54.5% of open Polymarket markets with quotes on both sides had a spread wider than 10¢. In those markets the percentage on the page can be a trade from days ago, and you may not be able to buy anywhere near it.
How much money does it take to move a Polymarket price?
In most markets, very little. Among the 111,488 open markets priced between 5¢ and 95¢, less than $100 of buying would push the YES price at least 5¢ above the midpoint in 78.1% of them, and less than $1,000 in 93.6%. In markets that traded between $100,000 and $1 million that week, the median was $8,721; above $1 million, $21,474.
ACDC measured the same thing on congressional markets at the end of September 2026: in 55.1% of those with live order books, less than $1 of trading moved the price 5¢ from the midpoint. In one case in December 2025, a single $1,240 trade moved a Texas primary market 11¢, and a news story reported the new price soon after (ACDC). At the other end, researchers estimated that moving the 2024 presidential market by 5 points in October 2024 would have cost about $9.1 million (arXiv).
A price that a few hundred dollars can move is a weak signal. Our report on insider trading cases shows how informed traders use such markets, while our check of the 2026 midterms found that in the deep election markets every favorite priced at 90% or more won, 391 of 391.
Is Polymarket or Kalshi more liquid?
Both have the same long tail. We counted Kalshi's open markets at 13:46 UTC on November 6, leaving out its multi-leg combinations:
| November 6, 2026 | Polymarket | Kalshi |
|---|---|---|
| Open markets | 262,071 | 185,743 |
| No trades in the past 24 hours | 92.8% | 87.3% |
| Never traded | 82.6% | 64.2% |
| No two-sided quote (no bid or no ask) | 44.6% | 42.9% |
| Median spread where both sides are quoted | 20¢ | 6¢ |
| Spread over 10¢ where both sides are quoted | 54.5% | 29.5% |
| Top 1% of markets' share of 24-hour volume | 94.3% | 89.7% |
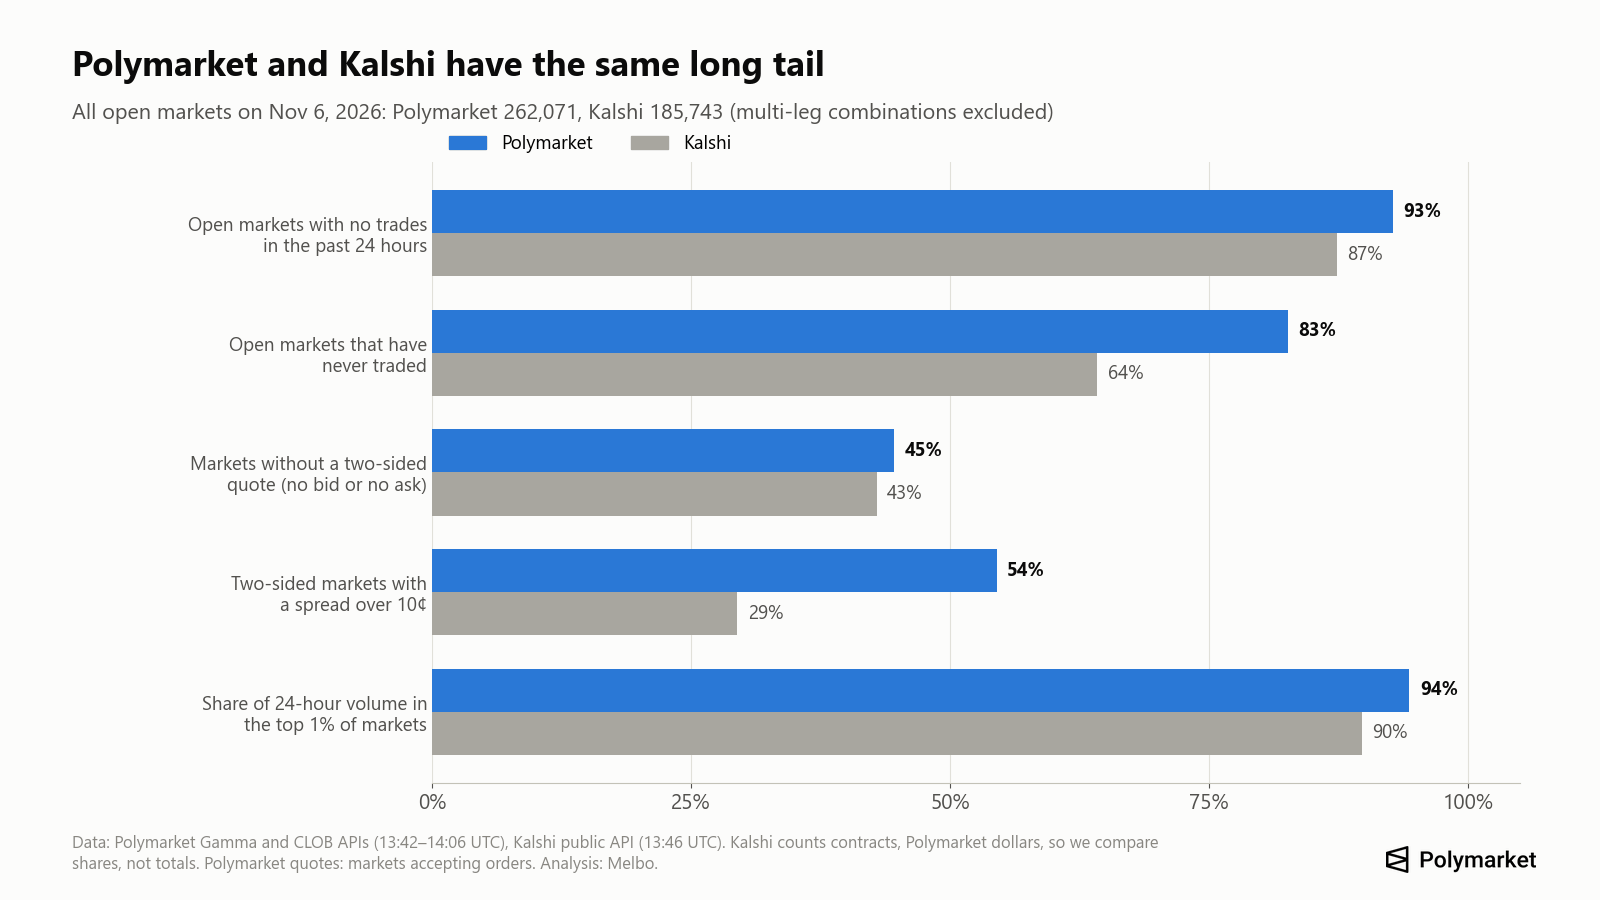
By these measures Kalshi's long tail is a little less empty: more of its markets have traded at least once, and where both sides are quoted, its spreads are tighter. On both platforms about 90% or more of a day's volume goes to 1% of the markets, and the busiest markets on both are deep. The difference is in the tail, so check the liquidity of the market you want to trade rather than the platform. Kalshi counts volume in contracts and Polymarket in dollars, which is why we compare shares rather than totals.
Why do thin markets exist at all?
Because listing a market costs the platform little, and liquidity has to be paid for. Polymarket runs a liquidity rewards program: it pays market makers daily for resting orders close to the midpoint, scored by a formula that rewards tighter quotes, and below 10¢ or above 90¢ the quotes must be on both sides to count (Polymarket docs). Each market gets its own budget. The busiest Stranger Things market in January had a daily reward rate of 50; the open "by December 31" market now has 2, and the March 2027 market has an 8.5¢ spread, wider than its reward band.
Kalshi pays designated market makers through reduced fees and adjusted position limits in exchange for two-sided quotes, and in 2026 it added a program aimed at markets "that are new or would otherwise have more limited trading activity" (Kalshi Help Center). Rewards keep the main markets tight. They do not reach the hundreds of player-prop markets under each game.
How to check liquidity before you trade
- Look at the spread, not the percentage. If the bid is 40¢ and the ask is 52¢, a buy costs 52¢ and an immediate sale returns 40¢. Above a 10¢ spread, the percentage on the page is the last trade.
- Look at the depth. Count how many shares sit within 1–2¢ of the best price. If your order is bigger, you will move the price against yourself.
- Check the volume of your outcome, not the event. A $10 million event can hold a $500 outcome.
- Check recent trading, not lifetime volume. A market that traded $15 million in January can be empty today.
- Use limit orders in thin markets. A limit order at your price waits for a seller instead of walking up the book. Splitting a large order helps only if the book refills between pieces.
- Plan the exit. Selling before resolution costs the spread again. In a thin market, holding to resolution may be the only cheap exit.
- Treat headlines from thin markets with care. A price that moved on a few hundred dollars says little about what most people expect.
Our guide to how prediction markets work explains how price, probability and payout fit together.
How we did this
On November 6, 2026 at 13:42 UTC we downloaded every open event from Polymarket's public Gamma API (keyset pagination, 20,156 events, 413,062 markets of which 262,071 open) and the order book of every open market accepting orders from Polymarket's public CLOB API (235,847 books). The YES book mirrors the NO book, so one side is enough. Weekly volume is each open market's 7-day volume field; for closed markets we use lifetime volume and closing time, because their weekly fields are unreliable. For markets that closed between October 30 and November 6, we listed every event closed in that window by closing time (39,502 events, 288,226 markets). Markets opened and closed inside the window count with their full volume; markets opened earlier are left out of the weekly totals. For the election comparison we re-read the 1,262 events from our snapshot of November 3, 09:53 UTC and took the change in lifetime volume. The round trip is a market buy of YES for $100 or $1,000 that walks up the offers, followed at once by a market sale of the same shares down the bids, on up to 1,500 random markets per volume group (books re-read at 14:18 UTC); "$ to move price 5¢" is the value of all offers between the midpoint and 5¢ above it. Both are reported for markets priced between 5¢ and 95¢. Kalshi data is every open market from its public API with status "open", excluding multi-leg combinations. Volume definitions differ between the platforms, so we compare shares and counts, not dollar totals.
Frequently asked questions
What does volume mean on Polymarket?
It is the dollar value of trades in a market over a period. It measures activity, not money invested, and it can be inflated by wash trading. Whether Polymarket's figures count one or both sides of a trade is disputed; Kalshi counts contracts traded, one side of each trade.
Why did a Stranger Things market top Polymarket's weekly volume in November 2026?
Because the weekly field of its closed January markets was never reset. $19.31 million of the $19.4 million came from four markets that closed between January 8 and March 1, 2026. Real trading that week was about $95,000.
How many Polymarket markets have no volume?
On November 6, 2026, 216,476 of 262,071 open markets (82.6%) had never traded, and 92.8% had no trades in the previous seven days. Most are player-prop and spread markets under sports games and newly listed markets.
What is slippage on Polymarket?
The difference between the price you expect and the average price you get when your order is bigger than the shares on offer at the best price. In our November 6, 2026 snapshot, a $100 market buy followed by an immediate sale returned a median of $96 in markets that traded over $100,000 that week and $73 in markets that traded under $1,000.
Is Polymarket or Kalshi more liquid?
Neither across the board. On November 6, 2026, 92.8% of open Polymarket markets and 87.3% of open Kalshi markets had no trades in the past 24 hours, and on both the top 1% of markets took about 90% or more of the day's volume. Kalshi had tighter quotes in the long tail: a median spread of 6¢ against 20¢ where both sides were quoted. Liquidity depends on the market more than the platform.
What are Polymarket liquidity rewards?
Daily payments to traders who keep limit orders near the midpoint of a market. Each market has its own budget, maximum spread and minimum order size, so busy markets attract tight quotes and small markets often do not.
How can I tell if a prediction market is liquid?
Check the spread between the best bid and ask, the shares available within 1–2¢ of the best price, and the past 24 hours of volume for the exact outcome you want to trade. A spread above 10¢ is a warning sign.
What to do next
Before your next trade, open the order book and check the spread and depth. Our guides on how prediction markets work and whether people make money on Polymarket cover the basics and the costs. To trade prediction markets with your own funds, you can start on Melbo from $1.